W2C Uttarkhand
PH Sensor data
Date:
Indicator:
This data was collected by W2C in March 2023 in Uttarakhand.
We have three methods through which we collect data.
First, we take raft rides and drag sensors through the water.
Second, we hang our sensors from a tube and take point samples.
And lastly, we collect water samples for lab processing.
Central Pollution Control Board (CPCB) Outdoor Bathing Water Quality Standards:
Total Coliforms MPN/100ml ≤ 500
6.5 < pH < 8.5
Dissolved Oxygen ≥ 5 mg/L
BOD ≤ 5 days 20C 3 mg/L or less
Irrigation, Industrial Cooling, Controlled Waste Disposal Standards :
6.0 < pH < 8.5
Electrical Conductivity ≤ 2250 uS/cm at 25°C
Sodium Absorption Ratio (SAR) Max. 26
Boron Max. 2 mg/L
https://cpcb.nic.in/water-quality-criteria/
NO3 Sensor data
Date:
Indicator:
This data was collected by W2C in March 2023 in Uttarakhand.
We have three methods through which we collect data.
First, we take raft rides and drag sensors through the water.
Second, we hang our sensors from a tube and take point samples.
And lastly, we collect water samples for lab processing.
Central Pollution Control Board (CPCB) Outdoor Bathing Water Quality Standards:
Total Coliforms MPN/100ml ≤ 500
6.5 < pH < 8.5
Dissolved Oxygen ≥ 5 mg/L
BOD ≤ 5 days 20C 3 mg/L or less
Irrigation, Industrial Cooling, Controlled Waste Disposal Standards :
6.0 < pH < 8.5
Electrical Conductivity ≤ 2250 uS/cm at 25°C
Sodium Absorption Ratio (SAR) Max. 26
Boron Max. 2 mg/L
https://cpcb.nic.in/water-quality-criteria/
Lab Data
Date:
Indicator:
This is data collected via a water sample (not continuous moving sensors) and sent to the lab for
testing.
This data has been tested by Devansh Testing & Research Laboratory Pvt. Ltd
www.dtrlab.org
Uttarakhand Pollution Control Board
Uttarakhand Pollution Control Board - Sewage Treatment Plants
Year-month:
Indicator:
Note: In 2023, the capacity for ‘Salawala STP’ is given as 0.71 MLD whereas in all other years it is given as 0.72 MLD.
https://ueppcb.uk.gov.in/pages/display/184-sewage-treatment-plant-(stp)
https://cpcb.nic.in/general-standards/
(note: see section 7 in annexure A)
Uttarakhand Pollution Control Board - Surface Metals
Year-month:
Indicator:
https://ueppcb.uk.gov.in/pages/display/96-water-quality-data
Uttarakhand Pollution Control Board - Water Quality Information
Year-month:
Indicator:
http://utrenvis.nic.in/water%20data.html
https://ueppcb.uk.gov.in/pages/display/96-water-quality-data
Central Pollution Control Board (CPCB) Outdoor Bathing Water Quality Standards:
Total Coliforms MPN/100ml <= 500
6.5 < pH < 8.5
Dissolved Oxygen >= 5 mg/L
BOD <= 5 days 20C 3 mg/L or less
https://cpcb.nic.in/water-quality-criteria/
Bhuvan
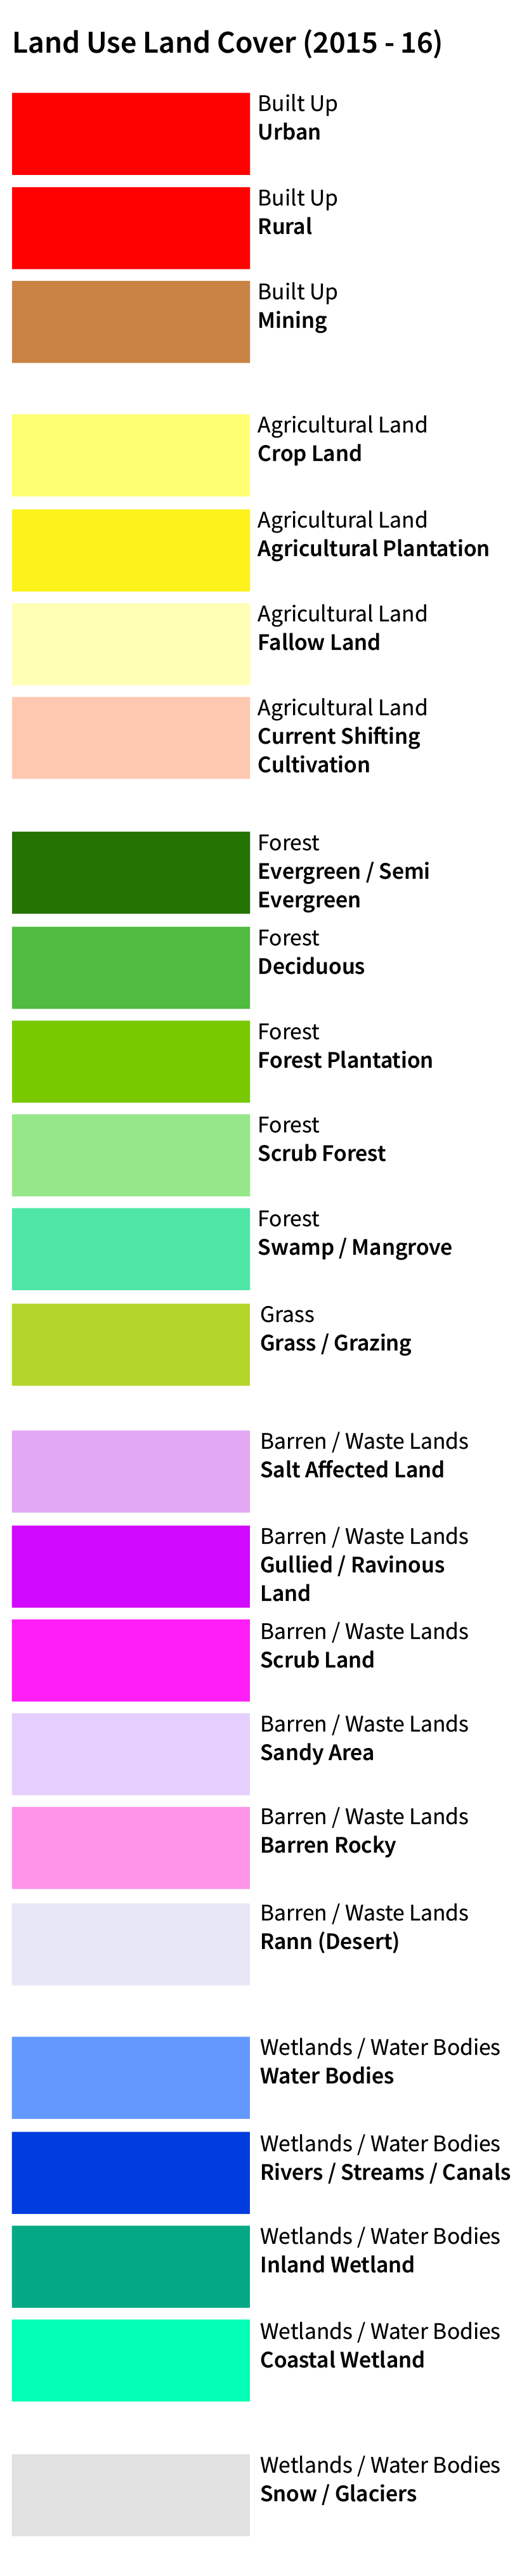
Bhuvan LULC
https://gis-siidcul.com/
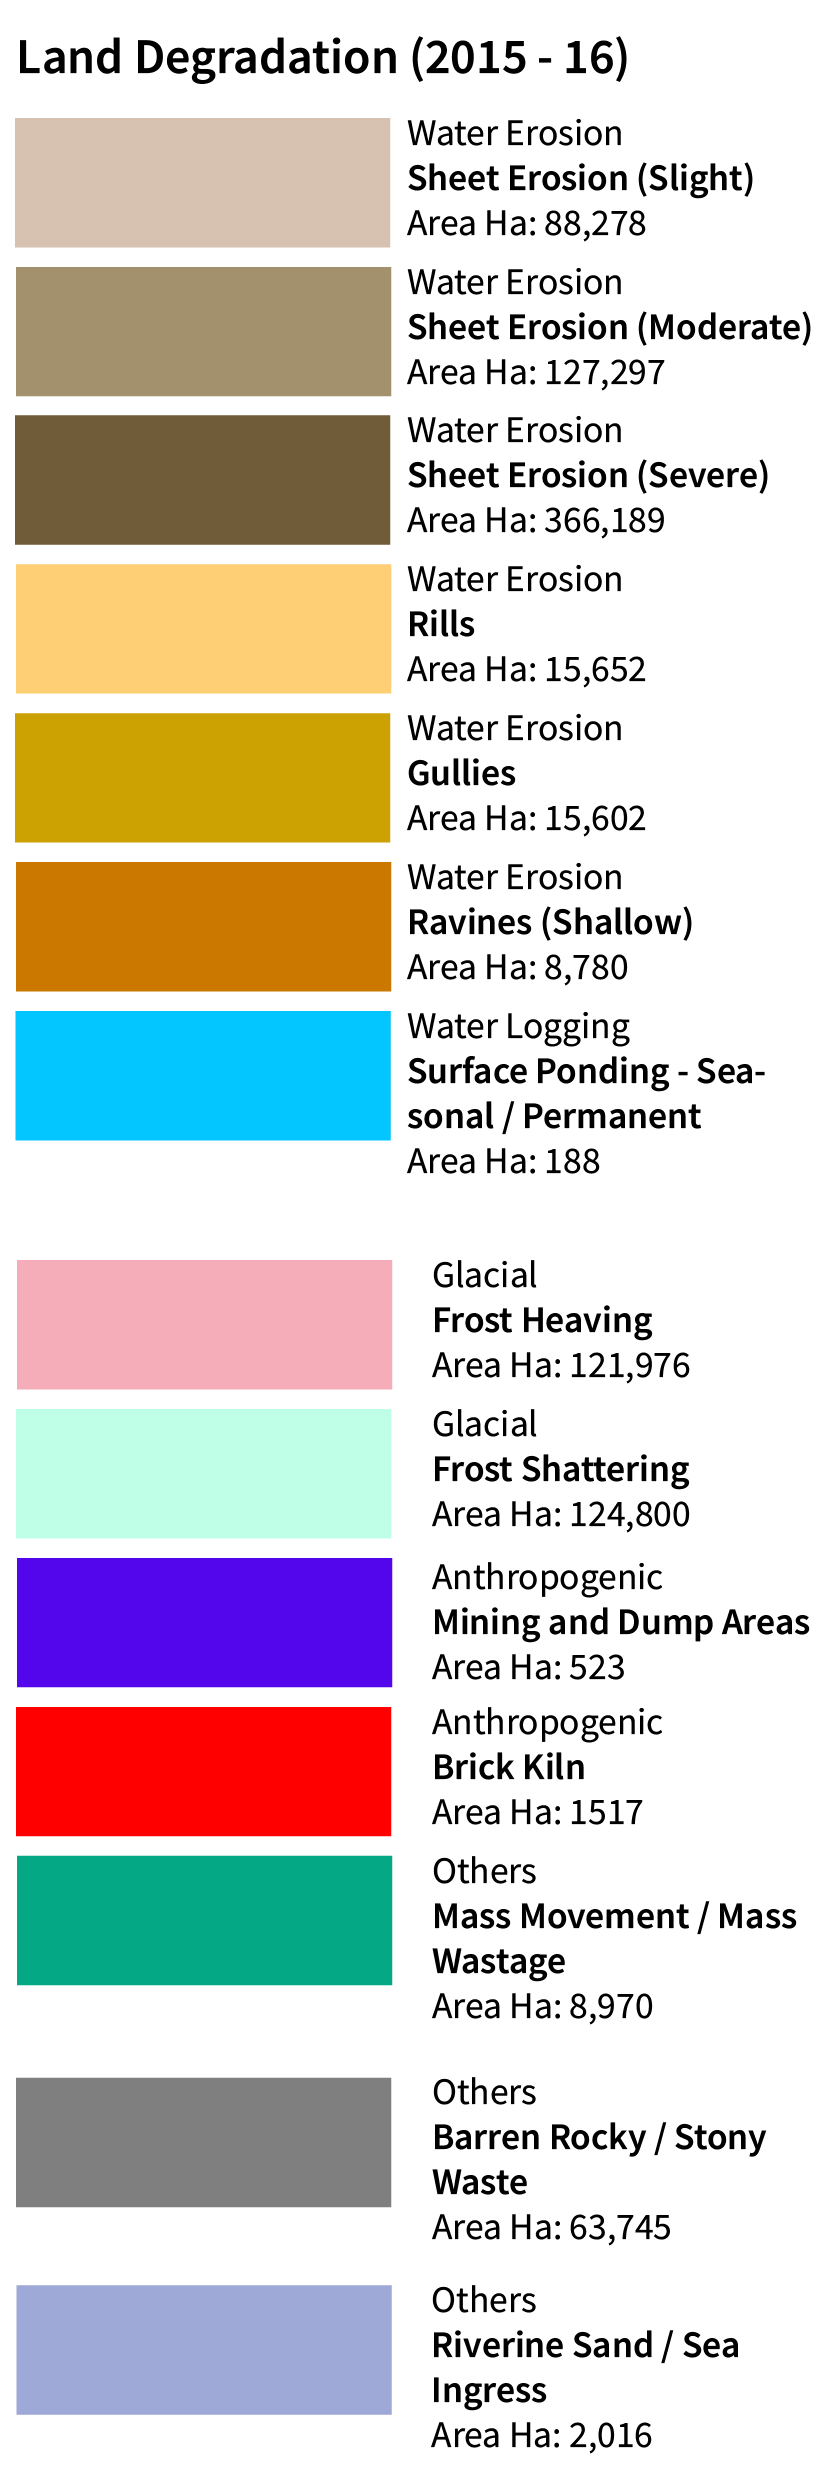
Bhuvan Land Degragation
https://gis-siidcul.com/
Industries
SIIDCUL industries

https://gis-siidcul.com/
Global data
Population Density
https://data.humdata.org/
WRI Powerplants
https://datasets.wri.org/dataset/globalpowerplantdatabase
Hydrosheds: Rivers
https://www.hydrosheds.org/
Hydrosheds: Waste Treatment Plants
https://www.hydrosheds.org/
About
Water-to-Cloud (W2C)
The Water-to-Cloud (W2C) project maps water quality using in-situ cyber-physical systems. W2C aims to create a unique, curated, publicly available repository of reliable water quality information from rivers across India to drive actions to improve the health of Indian water bodies and empower civil society organizations with quality information so that water resources may be more effectively managed.
The primary beneficiaries of our project are, firstly, population bodies spread across urban and rural India whose socio-economic lives are affected by the proximity of rivers—estimated at 400 million people in 2019.
Secondly, by democratizing access to water quality information, journalists, environmental workers, and civil society organizations will be able to visualize vast amounts of public environmental data that isn’t readily available, not because it is confidential, but because it is not machine readable nor is it curated effectively.
Since 2017, W2C has collected data in the Ganga, Godavari, Brahmaputra, and Yamuna rivers as well as in Bangalore Lakes and one-off projects with the Uttar Pradesh and Punjab pollution control boards. The W2C program was piloted in the Godavari River to observe industrial pollution, domestic sewage, anthropogenic activity in ghat areas and effects from religious holidays.
Something about how the sensor method is so that BOD and COD could be predicted using in-situ data, thus creating a low-cost, scalable, and quick monitoring approach that leverages IoTs for large-scale river mapping.
Most recently (March 2023), we completed fieldwork in Uttarakhand with the support of Windlas Biotech
W2C Uttarakhand Pilot Portal
Access to water quality information in India is fragmented and presented without contextual data. We imagine a pan-India portal where information is presented as a ‘geo-pixel’ (of land or water) against which relevant data and metadata, such as water quality parameters, population and settlement structures, proximity of industries and treatment plants, rainfall and other meteorological data is presented.
The convoluted and varied landscape of water quality information makes it difficult even for skilled scientists but certainly impossible for citizens and organizations to be present in the policy making process. The communication of water quality information determines how decisions are made about individual and societal actions (locations of industrial areas, urbanization, waterfront development, etc) and is crucial to creating a visible link between people and data.
Data
W2C uses mobile, time-stamped and geo-tagged cyber physical sensors to monitor water quality, generating high resolution data (approximately ~1000 data points in 3 hours over 10sqkm of water). We measure pH, dissolved oxygen, temperature, turbidity, electrical conductivity, colored dissolved organic matter, nitrate, ammonia and tryptophan fluorescence, based on the availability of sensors. We also do point sampling to measure Biochemical Oxygen Demand (BOD), Chemical Oxygen Demand (COD), fecal coliform, total suspended solids, major ions and heavy metals through lab analysis.
- pH
- Dissolved Oxygen (mg/L)
- Temperature
- Turbidity
- Electrical Conductivity
- Colored Dissolved Organic Matter
- Nitrate
- Ammonia
- Tryptophan
- Salinity (PSU)
- Biological Oxygen Demand (BOD)
- Chemical Oxygen Demand (COD)